Prodex in production
Prodex was developed and validated in a live manufacturing environment, where production, warehouse, quality, maintenance and planning processes operate on the same platform. The organisation remains anonymous, but the workflows described below reflect real daily production use.
Disconnected processes, fragmented information
Scattered information
Production information lived in separate processes and files — the same question had a different answer depending on where you looked.
Manual downtime
Because downtime was classified manually after the event, availability data depended on the completeness of manual records.
ERP apart from the floor
ERP data was disconnected from live machine activity, and warehouse, quality and maintenance each ran their own workflow.
Manual reporting
Management reporting was assembled by hand from multiple sources, every day.
Slow traceability
A traceability question meant collecting information from several places before an answer could be given.
What runs on Prodex, every day
These workflows run as part of daily production operations on Prodex.
Automatic downtime
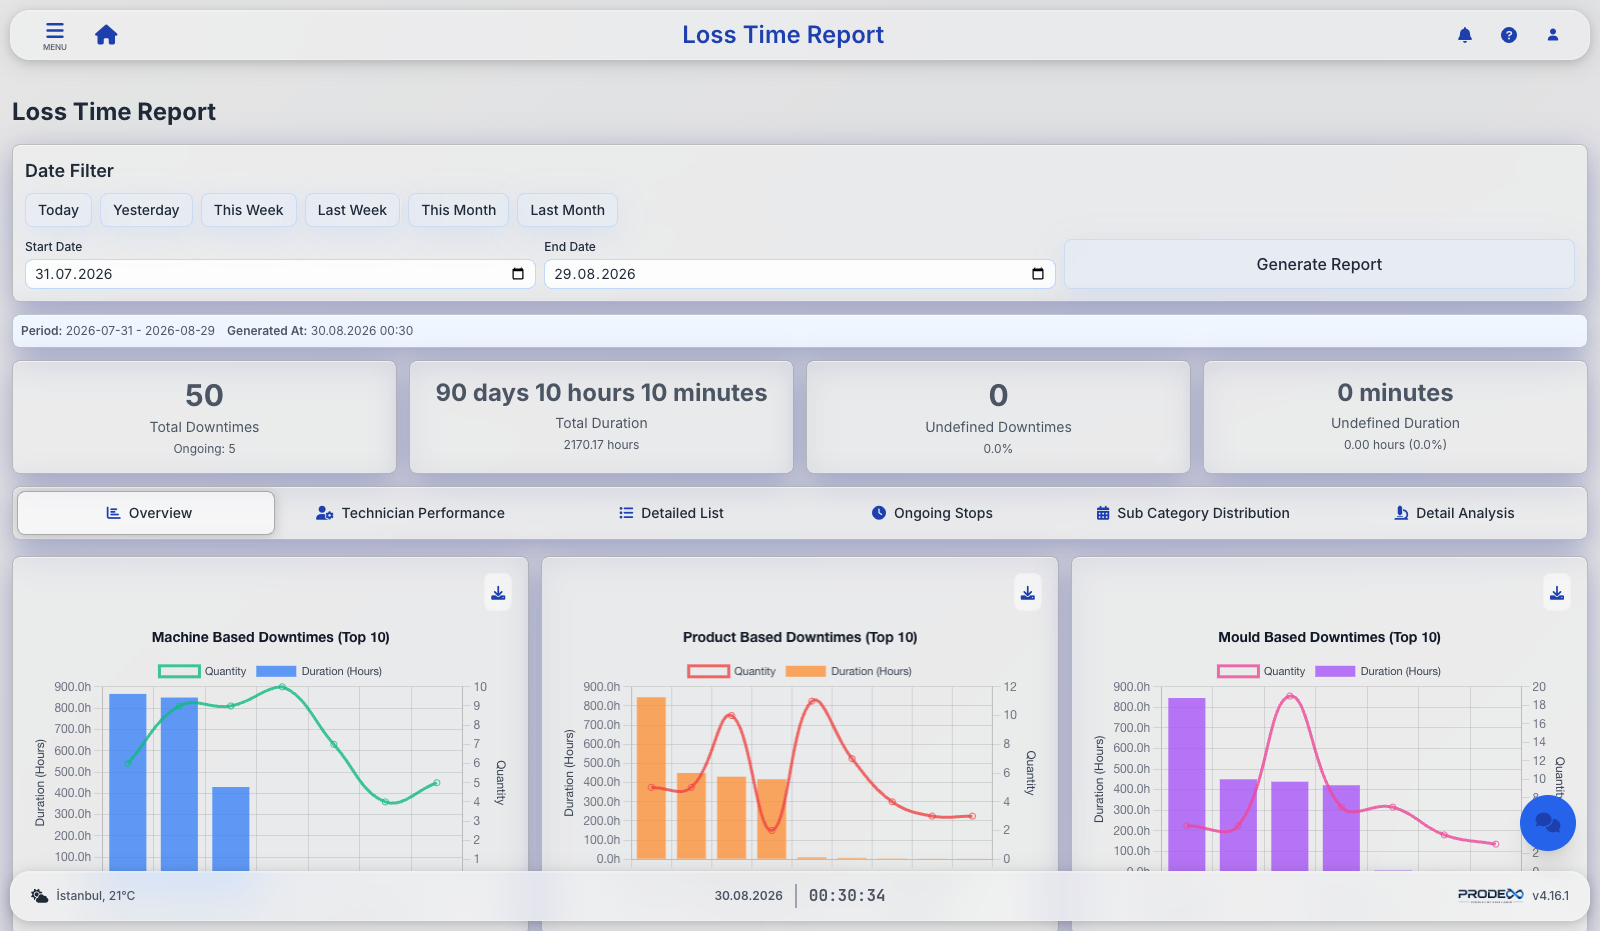
A machine counter stops → Prodex opens a downtime record → the operator classifies the cause → a supervisor validates it → the stop appears in OEE and the loss-time analysis.
Lot traceability
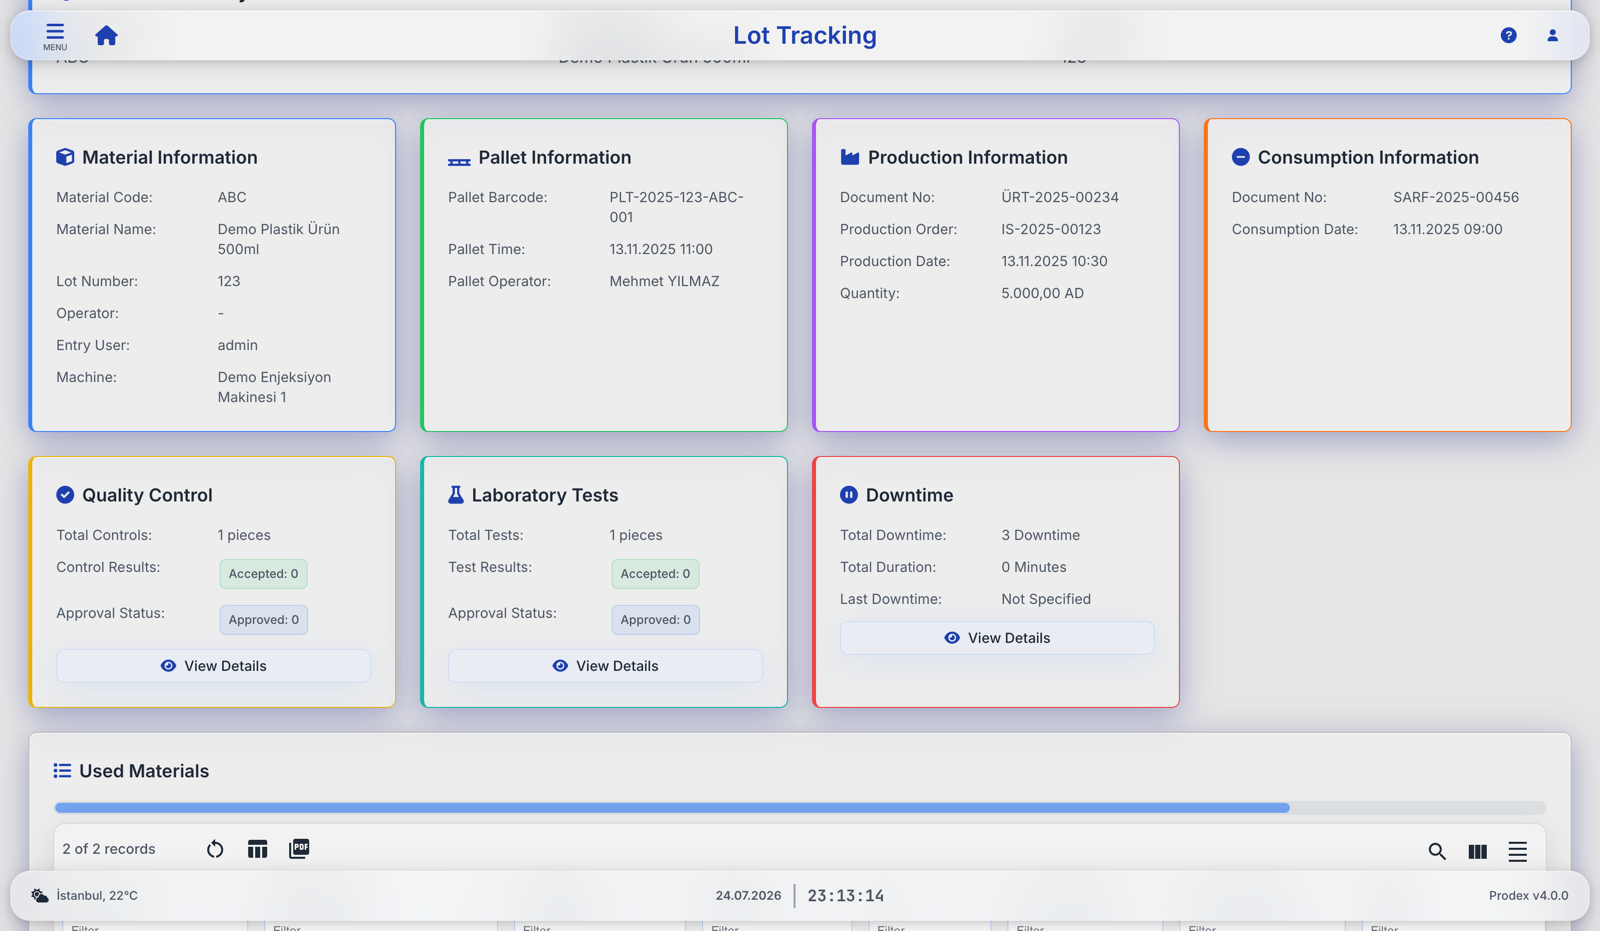
Raw-material lot → work order → machine and operator → quality results → pallet → shipment and customer. The chain is searchable from any point.
Connected maintenance
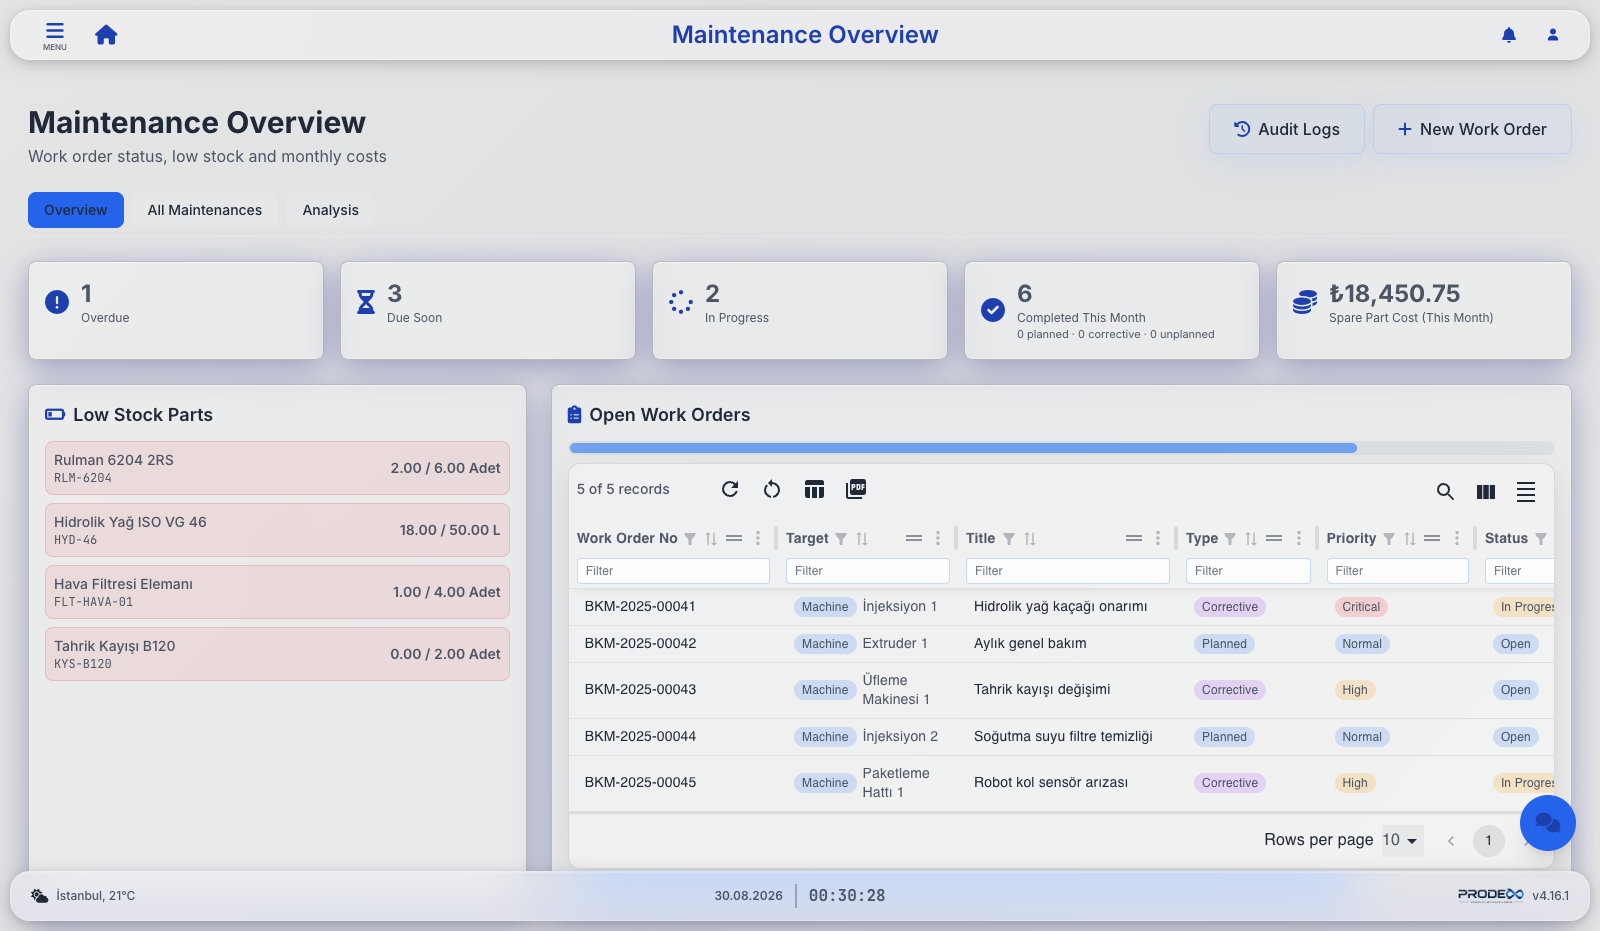
Maintenance plan → work order → technician sign-on → checklist with photos → spare-part consumption → the real cost of the maintenance, on the equipment's history.
Warehouse movements
Barcode or QR scan → stock validation → movement → ERP posting → traceability. Handheld transactions remain continuously synchronised with ERP.
Management reporting
Operational data flows into BI, and the daily management report is generated automatically as a PowerPoint deck — nobody assembles it by hand.
Shop-floor alerts
A machine or process event → Prodex → the andon screen and the responsible person's phone or WhatsApp → a recorded, verified response.
The real product. Real production workflows.
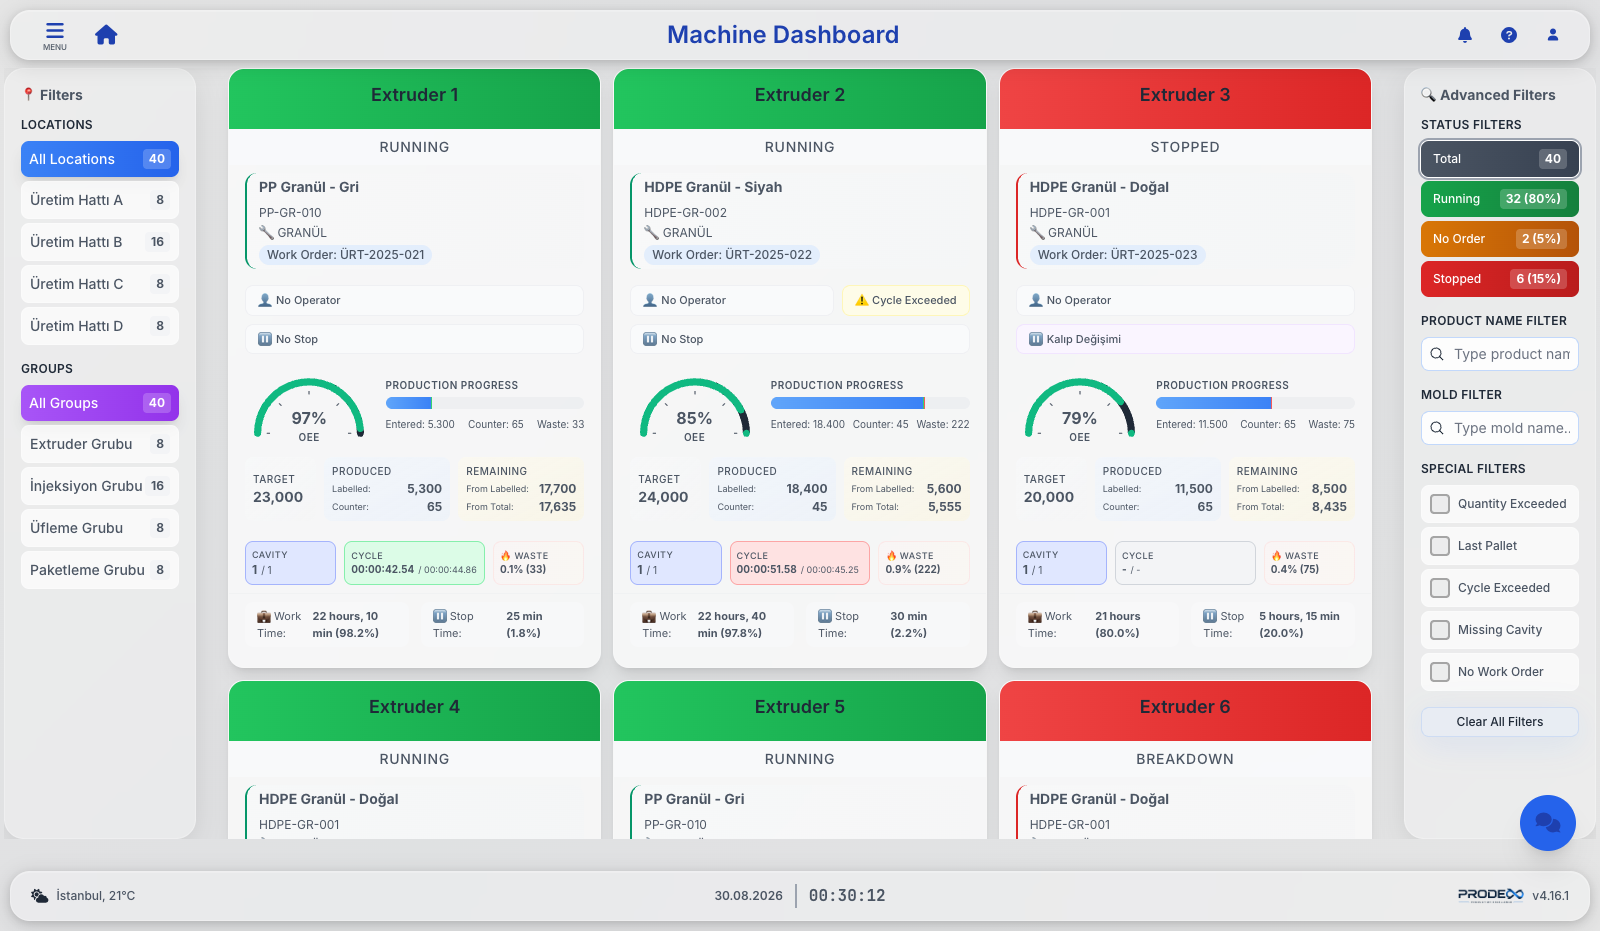
Genuine Prodex screens, shown here with demo data — the same interfaces the production deployment runs on.
What changed, in practice
- One operational data chain — from machine signal to management reporting, without re-entry
- Automatic downtime capture — instead of relying solely on manual reporting
- Lot genealogy on demand — available from supplier to shipment, from any starting point
- Real maintenance costs — spare-part consumption linked directly to equipment and maintenance records
- Quality tied to production — results linked directly to lots and work orders
- ERP and shop floor in sync — stock and production activity reconciled continuously
- One consistent data source — web, mobile and management reporting use the same operational data
The organisation remains confidential. Only demo data is used in publicly displayed product screens.
Ready to see Prodex on your own lines?
Get a guided demo with your own production scenarios — on-premise, with your ERP, in your language.